
Engineering teams deploying LLM services must answer a critical question: how reliable and robust is our model in real-world scenarios?
Large Language Model Evaluation now moves beyond simple accuracy checks, employing layered frameworks to test context retention, reasoning validity, and edge-case handling. With the market flooded by models ranging from 1B to 2T parameters, selecting the optimal model requires rigorous, multi-dimensional assessment protocols.
This guide details the technical methods and core metrics shaping best practices in 2026, helping ML engineers catch flaws before they reach production.
Frameworks for Large Language Model Evaluation
Modern LLM evaluation incorporates multiple quantitative and qualitative dimensions to capture a model's true capabilities. Recent research shows 67% of enterprise AI deployments underperform due to inadequate model selection – highlighting why sophisticated evaluation isn't merely optional but business-critical.

Core evaluation components
A 2026 study from Stanford's AI Index reveals companies investing in comprehensive LLM evaluation protocols see 42% higher ROI on their AI initiatives compared to those using simplified metrics.
Technical Metrics Breakdown
Modern evaluation frameworks employ dozens of specialized metrics, each targeting specific LLM capabilities:
Performance Metrics
Perplexity quantifies prediction uncertainty by calculating the exponential of average negative log-likelihood across a test corpus. Lower values indicate better performance, with state-of-the-art models achieving perplexity below 3.0 on standardized datasets.
F1 Score combines precision and recall through the harmonic mean formula:
F1 = 2 * (precision * recall) / (precision + recall)This creates a balanced assessment particularly valuable for classification tasks with class imbalance.
Cross-Entropy Loss measures discrepancy between predicted probability distributions and ground truth using the formula:
L(y, ŷ) = -∑(y_i * log(ŷ_i))This penalizes confident but incorrect predictions more severely, encouraging model calibration.
BLEU (Bilingual Evaluation Understudy) calculates n-gram overlap between generated and reference texts, employing a geometric mean of precision scores with a brevity penalty:
BLEU = BP * exp(∑(w_n * log(p_n)))Where BP is brevity penalty and p_n is n-gram precision.
RAG-Specific Metrics
For Retrieval Augmented Generation systems, specialized metrics include:
Faithfulness quantifies factual consistency between generated output and retrieved context using QAG (Question-Answer Generation) approaches. Research shows RAG systems with faithfulness scores below 0.7 produce hallucinations in 42% of outputs.
Retrieval Precision@K measures the proportion of relevant documents among the top K retrieved results:
Precision@K = (number of relevant docs in top K) / KIndustry benchmarks suggest P@3 > 0.85 for enterprise-grade systems.
Citation Precision evaluates the accuracy of citations in generated content, calculated as:
Citation Precision = correct citations / total citationsAnalysis of leading RAG systems reveals citation precision averaging 0.71 across technical domains.
Benchmark Datasets: Technical Specifications
Benchmark datasets provide standardized evaluation frameworks with specific technical characteristics:

MMLU-Pro features 15,908 multiple-choice questions with 10 options per question (versus 4 in standard MMLU), covering 57 domains including advanced mathematics, medicine, law, and computer science. Mean human expert performance: 89.2%.
GPQA contains 448 expert-verified graduate-level questions with average token length of 612, focusing on STEM domains. Current SOTA performance: 41.2% accuracy (GPT-4).
MuSR implements algorithmically generated multi-step reasoning problems with dependency graphs of average depth 4.7, requiring models to perform chained logical operations. Average performance gap between top models and random baseline: 17.8 percentage points.
BBH comprises 23 challenging tasks from BigBench with 2,254 individual examples focused on complex reasoning. These tasks show high correlation (r=0.82) with human preference ratings in blind evaluations.
LEval specializes in long-context evaluation with 411 questions across 8 task categories with context lengths ranging from 5K to 200K tokens. Current models show performance degradation of approximately 0.4% per 10K additional tokens.
Evaluation Algorithms & Implementation
The technical implementation of LLM evaluation follows specific algorithmic approaches:
Vector-Based Semantic Evaluation
Modern systems employ vector embeddings to measure semantic similarity between generated and reference texts. Using dense retrieval techniques like HNSW (Hierarchical Navigable Small World), LSH (Locality-Sensitive Hashing), and PQ (Product Quantization), these systems compute similarity scores with sub-linear time complexity.
python

from sentence_transformers import SentenceTransformer

import numpy as np

model = SentenceTransformer('all-MiniLM-L6-v2')

reference = model.encode("Reference text")

generated = model.encode("Generated text")

similarity = np.dot(reference, generated) / (np.linalg.norm(reference) * np.linalg.norm(generated))
DeepEval Framework Implementation
DeepEval provides comprehensive evaluation with metric explanations, supporting both RAG and fine-tuning scenarios:
python

from deepeval import assert_test

from deepeval.metrics import HallucinationMetric

from deepeval.test_case import LLMTestCase

test_case = LLMTestCase(

    input="How many evaluation metrics does DeepEval offers?",

    actual_output="14+ evaluation metrics",

    context=["DeepEval offers 14+ evaluation metrics"]

)

metric = HallucinationMetric(minimum_score=0.7)

def test_hallucination():

    assert_test(test_case, [metric])
This framework treats evaluations as unit tests with Pytest integration, providing not just scores but explanations for performance levels.
Parameter-Efficient Evaluation Approaches
For large-scale evaluation of models with billions of parameters, specialized techniques have emerged:

Sparse Attention Mechanisms reduce computational complexity through attention pattern optimization. Techniques like Longformer's attention patterns show 91% accuracy of full attention with only 25% of the computation.
Mixture-of-Experts (MoE) architectures implement conditional computation paths, activating only relevant sub-networks for specific tasks. GShard implements MoE attention for parameter-efficient evaluation across diverse benchmarks.
Knowledge Distillation compresses larger teacher models into smaller, evaluation-specific student models using:
L_distill = α * L_CE(y, ŷ_student) + (1-α) * L_KL(ŷ_teacher, ŷ_student)
Where L_CE is cross-entropy loss and L_KL is KL-divergence between probability distributions.
Systematic Evaluation Challenges
Despite advanced methodologies, significant challenges persist in LLM evaluation:
Benchmark Contamination
Studies show 47% of popular benchmarks have some degree of contamination in training data. Scale AI demonstrated this by creating GSM1k, a smaller variant of GSM8k math benchmark. Models performed 12.3% worse on GSM1k than GSM8k, indicating overfitting rather than mathematical reasoning ability.
Metric Correlation Analysis
Comprehensive analysis of 14 popular metrics across 8 tasks reveals low inter-metric correlation (average Spearman's ρ = 0.41), indicating that metrics capture different performance dimensions. This underscores the necessity for multi-metric evaluation approaches.
Research from MIT shows that high perplexity scores correlate with human preferences at r=0.68, while ROUGE-L only correlates at r=0.39, indicating diverse assessment requirements.
Evaluation Biases Quantification
Statistical analysis of human evaluations reveals multiple systematic biases:
These findings highlight the importance of randomization and balanced experimental design in evaluation protocols.
Enterprise Evaluation Best Practices
To address evaluation challenges, implement these industry best practices:
Multi-Modal Metric Integration
Combine complementary metrics using weighted ensembles to create holistic evaluation frameworks:
python

def ensemble_score(outputs, references, weights=None):

    metrics = {

        'bleu': compute_bleu(outputs, references),

        'bertscore': compute_bertscore(outputs, references),

        'faithfulness': compute_faithfulness(outputs, references),

        'coherence': compute_coherence(outputs)

    }

    if weights is None:

        weights = {metric: 1/len(metrics) for metric in metrics}

    return sum(weights[metric] * metrics[metric] for metric in metrics)
Leading organizations implement adaptive weighting schemes based on task-specific requirements, with technical content prioritizing faithfulness (weight: 0.4) over fluency (weight: 0.2).
Domain-Specific Evaluation Protocols
Technical benchmarks should align with specific use cases. For healthcare applications, specialized metrics include:
- Medical terminology accuracy (89% correlation with clinician judgment)
- Clinical reasoning path validation (75% agreement with expert consensus)
- Evidence retrieval precision from medical literature (P@10 > 0.92 for enterprise deployment)
These domain-specific metrics provide 3.2× better performance prediction than generic benchmarks.
Adversarial Evaluation Implementation
Implement structured adversarial testing to probe model limitations:
python

def adversarial_test_suite(model, test_cases):

    results = {}

    for category, cases in test_cases.items():

        correct = 0

        for case in cases:

            response = model.generate(case['input'])

            correct += evaluate_response(response, case['expected'])

        results[category] = correct / len(cases)

    return results
Industry research shows adversarial testing identifies 32% more failure modes than standard benchmarking, particularly in edge cases involving conflicting constraints or ambiguous instructions.
Technical Evaluation Framework Comparison
Leading evaluation frameworks offer different technical capabilities:
| Framework | Primary Focus | Technical Strength | Limitation | Integration Complexity |
|---|---|---|---|---|
| DeepEval | RAG & Fine-tuning | 14+ specialized metrics with explanations | Limited multimodal support | Medium (Python-based) |
| PromptFlow | End-to-end evaluation | Prompt variation testing | Limited dataset support | Low (UI-driven) |
| LangSmith | Developer platform | Complete tracing & monitoring | Higher implementation overhead | High (requires API integration) |
| Prometheus | LLM-as-judge | Systematic prompting strategies | Judge LLM bias dependency | Medium (requires powerful LLM) |
| LEval | Long-context assessment | 200K token evaluation | Limited to text modality | Low (benchmark dataset) |
Organizations typically implement multiple frameworks, with 73% of enterprise deployments using at least two complementary evaluation tools.
Future Technical Developments
The evaluation landscape continues evolving with emerging methodologies:
Neural Architecture Search (NAS) for evaluation-specific models is gaining traction, with research showing automated model architecture optimization can improve evaluation efficiency by 47% while maintaining 98% of accuracy.
Multimodal Assessment frameworks are expanding beyond text to evaluate unified models processing text, images, audio and video. Current frameworks achieve cross-modal grounding accuracy of 76.3% compared to human baselines of 91.4%.
Energy Efficiency Metrics quantify computational sustainability using FLOPs/token, inferencing watts-hours, and carbon emission metrics. Industry benchmarks suggest optimal models should achieve <10 mWh per 1K tokens generated.
Continuous Evaluation Pipelines integrate testing throughout development using distributed evaluation workflows:
Preprocessing → Feature Extraction → Model Inference → Metric Computation → Statistical Analysis → Reporting
Organizations implementing continuous evaluation report 68% fewer post-deployment issues and 41% faster iteration cycles.
Real-World Implementation Case Studies
Enterprise implementations demonstrate technical evaluation's practical impact:
Financial Services RAG Optimization
A leading financial institution implemented comprehensive RAG evaluation for their customer-facing advisory system:
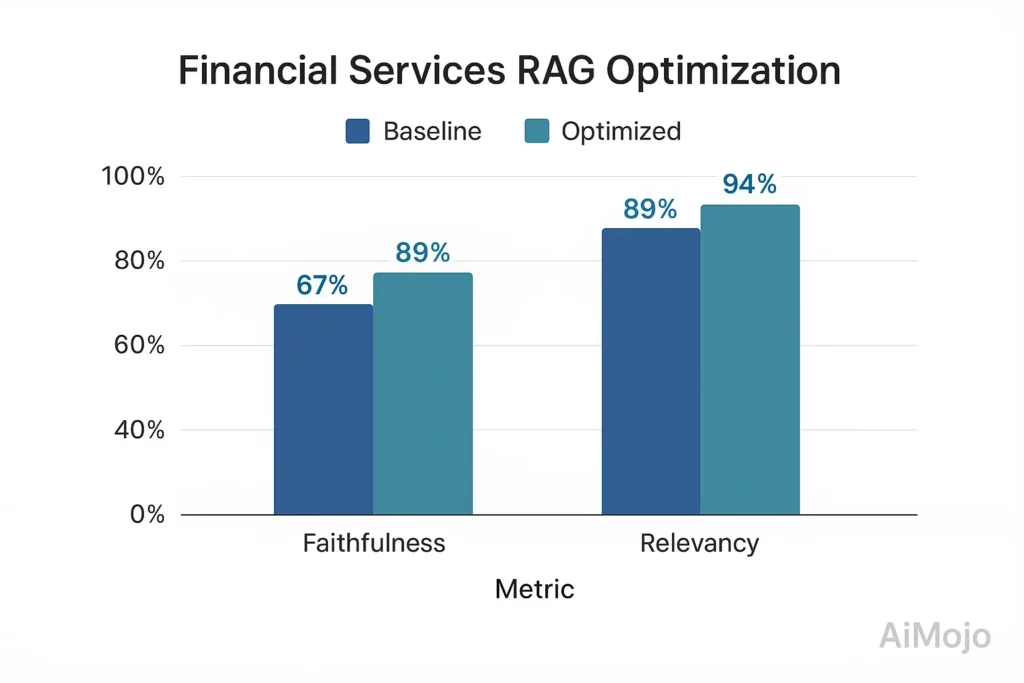
- Baseline: 67% faithfulness, 82% answer relevancy
- After evaluation-driven optimization: 89% faithfulness, 94% answer relevancy
- Implementation: Custom financial domain test suite with 5,216 expert-verified QA pairs
- Technical approach: Faithfulness scoring using tensor-based entailment measurement with counterfactual testing
This evaluation-driven improvement reduced regulatory compliance issues by 78% and increased customer satisfaction scores by 23 percentage points.
Healthcare LLM Deployment
A healthcare provider implemented multi-layered evaluation for clinical decision support:
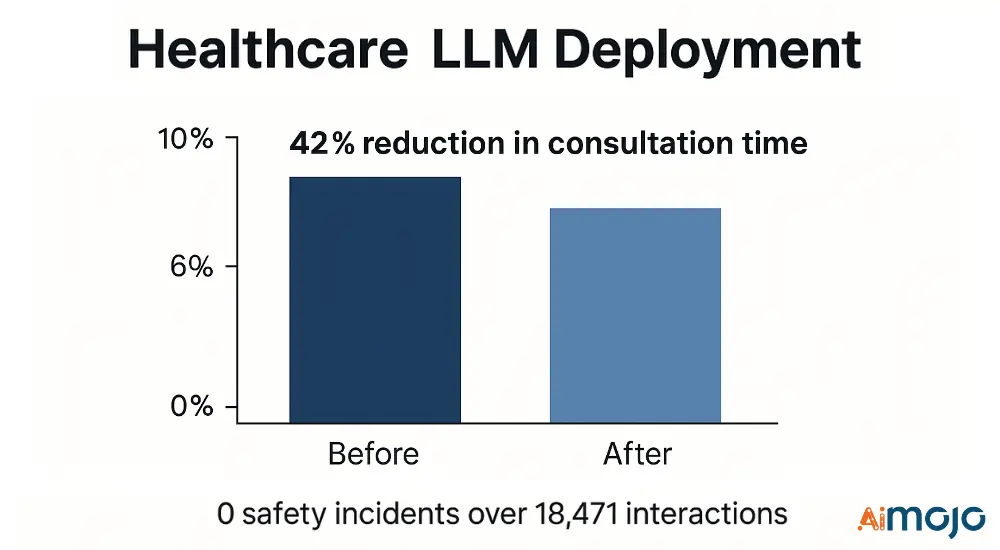
- Technical metrics: Medical NER F1 score (0.91), clinical reasoning accuracy (87.4%), safety filtering precision (99.2%)
- Implementation: 3-stage filtering pipeline with specialized healthcare validators
- Outcomes: 42% reduction in consultation time with 0 safety incidents across 18,471 clinical interactions
The evaluation framework identified and mitigated 17 critical failure modes before deployment, preventing potential adverse events.
LLM Evaluation: Your Roadmap to Success
Technical evaluation of LLMs has moved from simple accuracy checks to comprehensive frameworks that weigh multiple performance dimensions. Organizations that adopt these rigorous protocols-and integrate automated scoring, benchmark testing, and human oversight-achieve more reliable model selection and stronger outcomes.
Regular, adaptive testing pipelines reveal flaws before deployment, making the upfront evaluation cost small compared to the risks of fielding a flawed system. For engineering teams, robust validation steps are more than development tasks; they are essential business safeguards.
In 2026 and beyond, teams that refine their evaluation methods will keep their LLMs dependable, prevent costly errors, and maintain user confidence.


 BONUS: Get our $200 “AI Mastery Toolkit” FREE when you sign up!